
高濃度蛋白質溶液黏度值與溫度影響關聯性_Exploring Temperature Dependent Viscosity

高濃度牛球蛋白質溶液(250 mg/mL Bovine Gamma Globulin (BγG), 黏度值如何受溫度影響(如儲存&運輸溫度、製備(程)溫度),有別於傳統旋轉黏度儀分析受限於分析時間限制,只能於接近室溫或25°C下進行單點黏度分析。數據顯示25°C與4°C條件下,黏度值分別為82cp與430cp,只獲得25°C下黏度值顯然無法滿足蛋白質溶液應用。利用VROC® Initium微量黏度儀,搭配Arrhenius law擬合方程式,只需80ul樣品體積即可於單點溫度分析條件下,自動得到4, 25, and 37°C黏度值,克服傳統黏度分析限制,讓你掌握樣品黏度與溫度條件影響。
Introduction:
Viscosity analysis protocols for concentrated protein solutions are often limited to a single measurement point near room temperature or 25°C. Although this is relevant to the formulation process and perhaps even delivery, the value of measuring viscosity at additional temperatures should not be overlooked. Samples are commonly stored at reduced temperatures (e.g. 4°C) to prolong stability and ultimately introduced into the body which has an average temperature of 37°C. Intermediate temperatures are also likely to be relevant since manufacturing conditions and the environment during product delivery can vary. Since 37°C is generally below the denaturation or melting temperature of most protein solutions, the Arrhenius law can be fit to a select number of data points and then used to interpolate as needed to predict behavior under a variety of conditions.
Experimental Details:
A 250 mg/mL Bovine Gamma Globulin (BγG) formulation was prepared in phosphate buffered saline (PBS). The viscosity was measured at 4, 25, and 37°C with the VROC® Initium using a B05 flow channel (depth = 50 µm, max pressure = 40 kPa). The automatic testing mode, which adjusts the flow rate to achieve pressure readings at 50% of full scale, was used at each temperature. For comparison, PBS was also measured over the temperature range of 4 – 43°C at a shear rate of approximately 19,000 sec-1. The loaded sample volume for both the buffer and protein solution was 80 µL. The sample retrieval feature was activated so that all temperature variations were performed on a single loaded volume.
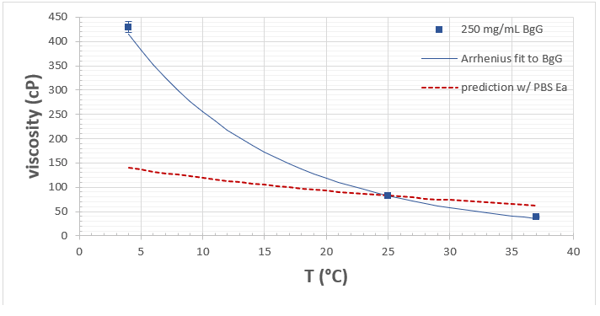
Figure 1: Viscosity versus temperature of 250 mg/mL BgG in PBS (blue squares). Error bars represent three standard deviations. Solid blue line corresponds to Arrhenius fit to protein formulation data. Dashed red line is the prediction using the activation energy (Ea) of the PBS buffer.
Viscosity Data & Analysis
The viscosity versus temperature data for the BgG solution is presented graphically in Figure 1. Values are also tabulated along with shear rates and statistical information (Table 1). The viscosity of this concentrated protein solution rises from about 82 to 430 cP as the temperature is reduced from 25 to 4°C. If the formulation must be processed, delivered, or handled in any way at reduced temperatures, measuring at only 25°C would be misleading and ultimately problematic.
The maximum measurement temperature of 37°C is below the point at which the BgG would denature, and the viscosity consistently decreases with increasing temperature. The Arrhenius expression for viscosity (h) as a function of temperature (T) is then an option to fit the data.
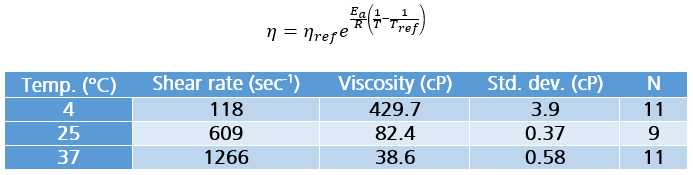
Table 1: Measurement details for BgG solution at each temperature including shear rate, viscosity, standard deviation (std. dev.) and number of replicates (N).
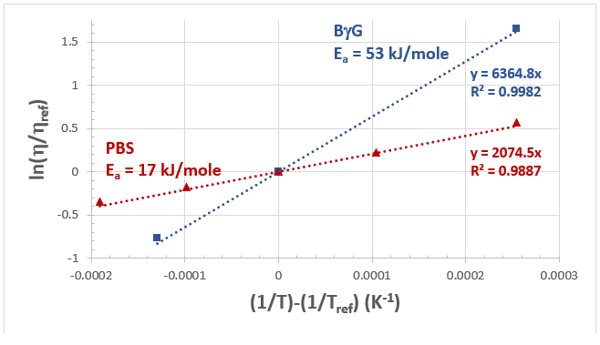
Figure 2: Viscosity-temperature data and Arrhenius fits for both the buffer and BgG solutions. The reference temperature (Tref) is 25°C = 298.15 K.
Ea is the activation energy specific to the system and R the universal gas constant equal to 8.314 J/(mole K). Reference values are indicated with the subscript “ref” and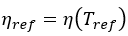 . The equation can be rearranged to the following to facilitate fitting the experimental data and extracting the activation energy from the slope.
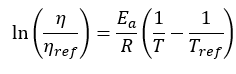
Figure 2 illustrates the model fit to both the PBS and the concentrated BgG solution with a reference temperature of 25°C or 298.15 K. The R2 values suggest that the Arrhenius model is reasonable over the measured temperature range. Activation energies were extracted from the slope for both the PBS (17 kJ/mole) and the BgG solution (53 kJ/mole). Although it has been observed that the activation energy of dilute protein solutions will approach that of the buffer (Dharmaraj et al., 2016), the 250 mg/mL BgG solution is clearly well beyond that concentration regime. Although the buffer activation energy may be readily available or even well approximated with that of water, attempting to predict the temperature dependence of the concentrated protein solution with this value would result in significant error (Figure 1). In this case, the deviation from the true values would range from -68 to 63 %. However, having the true activation energy for the BgG would allow interpolation to any relevant temperature.
Concluding Remarks
The fully automated VROC® Initium with the retrieval feature activated makes measurement at multiple temperatures possible with a single loaded volume. The closed system design also eliminates any artifacts due to evaporation. A simple model fit to a few properly selected data points can then be used to interpolate to any relevant temperatures related to processing or application.
References
- L. Dharmaraj, P. D. Godfrin, Y. Liu, and S. D. Hudson, “Rheology of clustering protein solutions,” Biomicrofluidics 10, 043509 (2016)